SA4576 - Valuation (stock turns for date period)
Summary
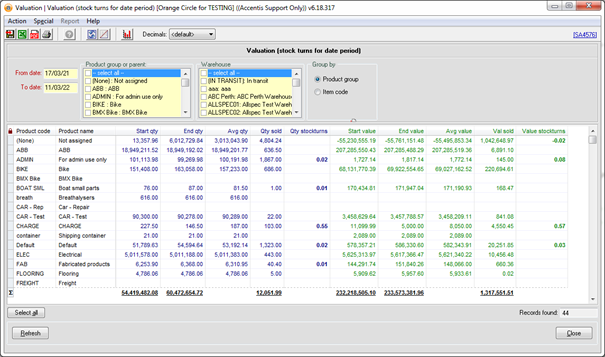
SA4576 is an inventory valuation report showing the “stock turns” over a given period. It is used to report on how frequently your stock is turned over in comparison to the quantity on hand.
Sample Report
Filters
|
From date |
Start of date range for analysis |
|---|---|
|
To date |
Ending date range for analysis |
|
Product group or parent |
Filters the results down to certain groups or products |
|
Warehouse |
Filters the results down to specific warehouses |
| Warehouse | Groups results by Product group or Item code |
Data Returned
All data presented on this report is extracted from the list of inventory transactions in your database (these can be seen by using SA3497).
Columns
This table represents the list of Columns and the calculations that are being displayed:
| Column | Meaning |
| Product code | The product group code of the data being returned |
| Product name | The full product group name related to the product code above |
| Item code | If grouping by item, this is the item code for the data being returned |
| Item description | The item description from the item record |
| Start qty | The quantity in stock at the start of the selected reporting period |
| End qty | The quantity in stock at the end of the selected reporting period |
| Avg qty | The average quantity in stock over the period. This is calculated as (Start Qty + End Qty) / 2 |
| Qty sold | Total quantity of items (in their base UOM) that were removed from stock over the reporting period. Note that this includes transactions that are typically classified as "consumption" transactions: Dispatch, Work order start, Stock assignment, Receive assignments, Repairs. |
| Qty stockturns | This is a calculation of Qty sold / Avg qty. It represents how many times your stock qty has been turned over (sold or consumed) in the reporting period |
| Start value | The value of stock at the start of the reporting period |
| End value | The value of stock at the end of the reporting period |
| Avg value | The average value of stock at any point in time. This is calculated as (Start value + End value) / 2 |
| Val sold | The total cost value of items that have been consumed in the reporting period (taken out of stock) |
| Val stockturns | This is a calculation of Val sold / Avg value. It represents how many times your stock value has been turned over (sold or consumed) in the reporting period |
Last edit: 17/03/22